
Introduction
In my book “The Value Dividend Strategy”, which was published in late November 2022, I provided readers with two portfolios which, at that time, fulfilled the criteria of what I named The Value Dividend Strategy.
The book is based on extensive research I did as part of my bachelor thesis. In my research process, I stumbled upon value stocks which outperformed not only the market but nearly as often also the general value portfolio they were part of.
These stocks were in particular undervalued stocks which either pay a significantly high dividend or no dividend at all. For investors, these stocks are raising suspicion as outliers. An extremely high dividend seems too good to be true, while the lack of dividends is equally unusual for value stocks. As it turns out, these stocks historically performed phenomenally good, especially towards the end and coming out of a market recession.
After I published my book and sold the first hundreds of copies over the recent months, a handful of investors asked me to please regularly update the Value Dividend portfolios and to extend my research. With this newsletter, I will create and update the Value Dividend portfolios every quarter and transparently publish performance reviews of how each portfolio performed in the past. Furthermore, I will identify the winning stocks of each portfolio, which were raising the performance, and write deep dive analyses on these selected stocks. Another part I deem extremely important as an investor is an understanding of the macroeconomic environment – not to time the market, but to identify opportunities where others cannot yet see them. In this newsletter, Value & Dividends, I will also write research newsletter on undervalued sectors and macroeconomic opportunities and risks.
Q4 2022 Value Dividend Portfolios
On 21st of October 2022, I screened the U.S. stock market according to The Value Dividend Strategy criteria. As a result, I created two portfolios: one focused on value stocks which paid a significantly high dividend and one focused on value stocks which paid no dividends at all.
In my book, I emphasized that The Value Dividend Strategy is particularly effective and yields the best returns when implemented towards the end of a recession. Nevertheless, in this performance review, we will assess the performance of the two portfolios I established in October 2022.
I never expected that I’d expand or delve into the portfolios again. For this reason, I will focus for simplicity on the performance of the portfolios from the date of the creation of the portfolio (21/10/2022) to today (13/07/2023). Thereby we’re looking at the performance after approximately 8.8 month or 38 weeks.
However, moving forward, I will track and publish performance updates on a quarterly, half-yearly, and yearly basis.
At the time of creation, all stocks within the Value Dividend portfolios displayed a low P/B ratio, high or no dividend payments, an Altman Z score of > 2.99, a Piotroski F-Score of >6, and an Equity-to-asset ratio of <0.5.
Performance of the Dividend Portfolio
The Value Dividend portfolio with high dividends consisted of 14 stocks.
As I am writing this, the overall performance since creation of the portfolio is 26.48% excluding paid-out dividends.
The average dividend yield of this portfolio was 4.2% at the date of creation.

The average performance of 26% comes with a standard deviation of 31%. The highest performance showed InterDigital Inc. (IDCC) with 104% while Valero Energy Corp (VLO) performed worse with -8% – simultaneously VLO was the only stock in this portfolio with a negative performance.
The average dividend yield is approximately 4.19%, with a standard deviation of 1.84%. This indicates a wide range of dividend yields among the companies, with a maximum yield of 8.98%.
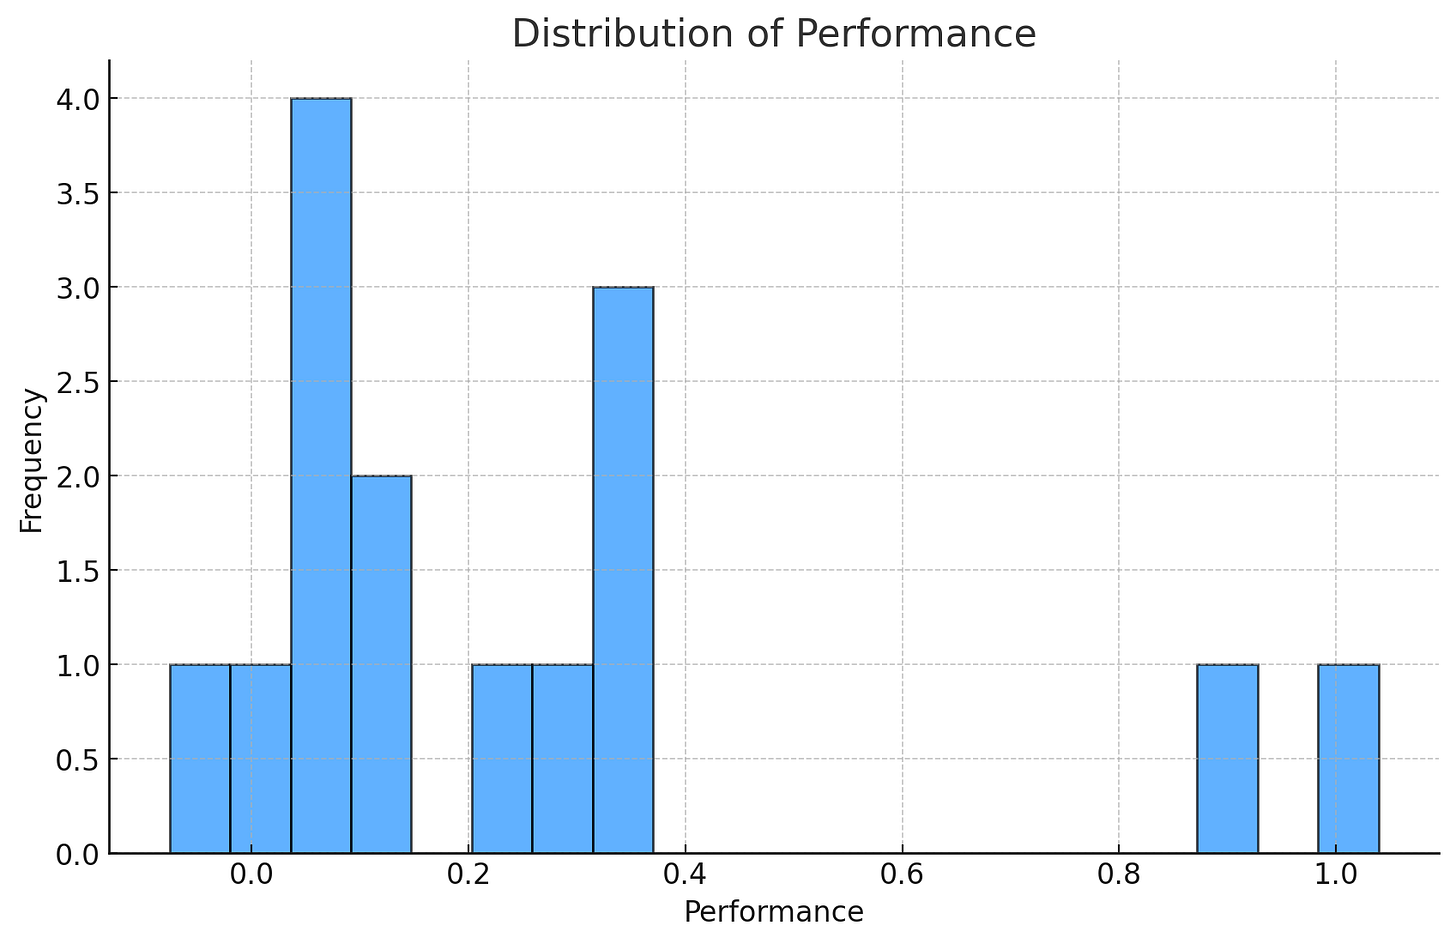
When we look at the distribution of stock performance, we can see that most of the stocks have gained between 0% and 40% with two notable exceptions exhibiting a much higher performance.
When we look at the correlation between performance and dividend yield, we can see a moderate positive correlation. This suggests that higher-performing stocks also tended to have higher dividend yields, which proves the point of The Value Dividend Strategy.
Top 5 Performers of the Value Dividend High Dividend Portfolio:
- InterDigital Inc IDCC with a gain of 104%
- Patrick Industries Inc PATK with a gain of 91%
- LCI Industries Inc LCII with a gain of 35%
- Ingredion Inc INGR with a gain of 34%
- Celanese Corp CE with a gain of 32%
Hypothetically, by investing in these five stocks, one could’ve achieved a return of 59% with – important to note – value stocks.
Bottom 5 Performers of the Value Dividend High Dividend Portfolio:
- Valero Energy Corp VLO with a loss of 7.6%
- Exxon Mobil Corp XOM with a gain of 2%
- Phillips 66 PSX with a gain of 4%
- Global Partners LP GLP with a gain of 8%
- Huntsman Corp HUN with a gain of 9%
As we can see, particularly VLO has been a bad pick. The question is not why VLO had been a bad pick, but how we can avoid picking losers in the future altogether. I want to answer this question in this continuous newsletter by through deep dives, not only in promising Value Dividend stocks but also into suspicious ones and perform a due diligence, valuation, and margin-of-safety calculations. If you haven’t already, I welcome you to subscribe!
Performance of the Non-Dividend Portfolio
The Value Dividend portfolio which paid no dividends consisted of 21 stocks.
As I am writing this, the overall performance since creation of the portfolio is 26.06%.

In the Value Dividend portfolio which pays no dividends, the average performance was 26% with a standard deviation of 47%. This standard deviation is quite high, as some stocks performed exceptionally well (155.79%) while others showed high losses (-46.18%).

Looking at the distribution of returns, we see that most of the stocks in the Non-Dividend portfolio show returns of 0 to 60% with a few notable exceptions exhibiting much higher or lower performance.
This was to be expected, as I observed similar high standard deviations during my study of Value Dividend stocks. Yet, as we can see, with a performance of 26% of the overall portfolio we still achieved higher returns than the S&P 500, which gained 13.23% over the same period of time.
When we look at correlations, it may be worth noting that there is a moderate negative correlation between performance and P/B ratios. Stocks with a higher performance had lower P/B ratios which may be because they were undervalued.
Top 5 Performers of the Value Dividend Non-Dividend Portfolio:
- Builders FirstSource Inc BLDR with a gain of 156%
- AutoNation Inc AN with a gain of 86%
- Asbury Automative Group Inc ABG with a gain of 78%
- GMS Inc GMS with a gain of 70%
- US Goods Holding Corp USFD with a gain of 62%
Hypothetically, investing in these 5 Value Dividend stocks would’ve resulted in a 90% gain with low P/B stocks.
With non-dividend paying value stocks, the challenge is to weed out the bad performers, while focussing on the high performers.
Bottom 5 Performers of the Value Dividend Non-Dividend Portfolio:
- United Natural Foods Inc UNFI with a loss of 46%
- Ascent Industries Co ACNT with a loss of 37%
- Stride Inc LRN with a loss of 20%
- TrueBlue Inc TBI with a loss of 18%
- DLH Holdings Corp DLHC with a loss of 17%
By looking at the bottom performers, it becomes clear how risky this strategy can be, if focussed on the wrong stocks and if one avoids diversification. With diversification, the overall portfolio nevertheless gained 26% – despite having several double-digit loss stocks in the portfolio.
As part of this ongoing Value & Dividends newsletter, I will dive deep into individual non-dividend paying stocks, to learn how we can promptly avoid investing in these losers stocks.
Index Performance
To set these performances in perspective: Over the same period of time, from October 21, 2022, to today, the S&P 500 gained 13.23% and the Vanguard Value Index Fund ETF (VTV) gained 8.88%. Thereby, both Value Dividend portfolios outperformed the index and the overall value index.

If you want to learn more on how I discovered this strategy and how the portfolios were created, you can read my book online or order a copy from amazon.com.
Résumé
Since publishing my book The Value Dividend Strategy, we can see that Value Dividend portfolios still outperform the index and large diversified value portfolio. With this newsletter and blog, I will continuously update, refine, and expand The Value Dividend Strategy. I will dive deep into selected promising or suspect Value Dividend stocks to find clear winners and loser within the small range of Value Dividend stocks.
Furthermore, I’ve been majorly invested in Palantir PLTR which does not fulfill Value Dividend criteria per se, but which was a stock clearly undervalued in 2022 and gained in 100% since October 21st 2022. As soon I detect other unique undervalued growth stocks, they will also have their place in Value & Dividends.
In combination with critical macroeconomic analysis, I aim to provide real value and real dividends to readers of this newsletter.
If you haven’t already – I invite you to join the Value & Dividends community and I appreciate your subscription to this publication.
Sincerely yours,
Marius Schober
Twitter: @mariusschober
LinkedIn: Marius Schober
Legal Disclaimer
The content provided in this newsletter is for informational purposes only. The information, analysis, and opinions expressed herein are solely those of Marius Schober and do not represent, reflect or express the views of any other person or entity.
This newsletter does not constitute investment advice, financial advice, trading advice, or any other sort of advice, and you should not treat any of the newsletter’s content as such. Marius Schober does not recommend that any securities, transactions, or investment strategies mentioned in this newsletter are suitable for any specific person.
The information provided in this newsletter is obtained from sources believed to be reliable, but Marius Schober does not guarantee its completeness or accuracy, or warrant its completeness or accuracy. Readers are urged to consult with their own independent financial advisors with respect to any investment.
All information and content in this newsletter are subject to change without notice. Prices, quotes, and other financial information may be out of date or inaccurate. Past performance is not indicative of future results. Investing in securities involves risks, including the potential loss of all amounts invested.
Marius Schober does not accept any liability for any loss or damage which is incurred from you acting or not acting as a result of reading any of our publications. You acknowledge that you use the information we provide at your own risk.
By subscribing to this newsletter, you acknowledge and agree to the terms of this disclaimer.

Leave a Reply